Graph Editor Overview
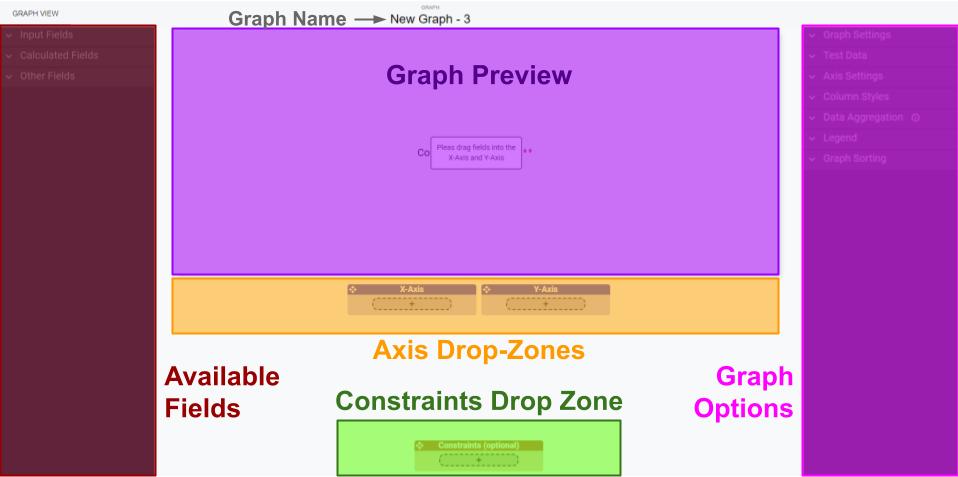
- Graph Preview
- This is where you will see a preview of your graph as you create it.
- This area becomes interactable as the graph is created and changed.
- Available Fields
- The sidebar that contains all the fields in your RLD project. Any of them can be added to the Axis Drop-Zones
- Axis Drop-Zones
- Each graph has a set of axes, many are shared between graph types but some have their own unique axes.
- Dropping a field into an axis drop zone will make the graph use that field for that axis. This will show a visible change in the graph Preview
- Graph Options
- This is where all the options for customizing your Graph and constraints can be found.
- From here you can change things like
- Styling
- Colors
- Data Aggregation
- Legend
- And More...
 Wiki
Wiki